What you own vs. the risk you actually have
A tracker answers "what is my portfolio worth?" A risk monitor answers "where am I exposed, and is it getting worse?" Guardfolio reads your holdings across every account and surfaces the exposures that hide between them.
Monitored risks
The risks hidden inside your portfolio
Each risk below has its own free tool. A risk monitor connects them: Guardfolio tracks all of them together and alerts you when one crosses your limit.
MetricsEight risk signals, checked automatically
Updated after portfolio data is synchronized. You review when the latest analysis finds a meaningful change.
Portfolio snapshot
- Health score 0–100 score from concentration, diversification, and volatility
- Allocation drift Current weights vs your targets and rebalancing bands
Exposure
- Position concentration Alerts when any holding exceeds your size threshold
- Sector weights GICS sector shifts as prices move
- ETF overlap Hidden duplicate holdings across funds
Market risk
- Volatility Annualized std dev vs your baseline
- Max drawdown Peak-to-trough decline and acceleration
- Correlation Correlation matrix to surface hidden concentration
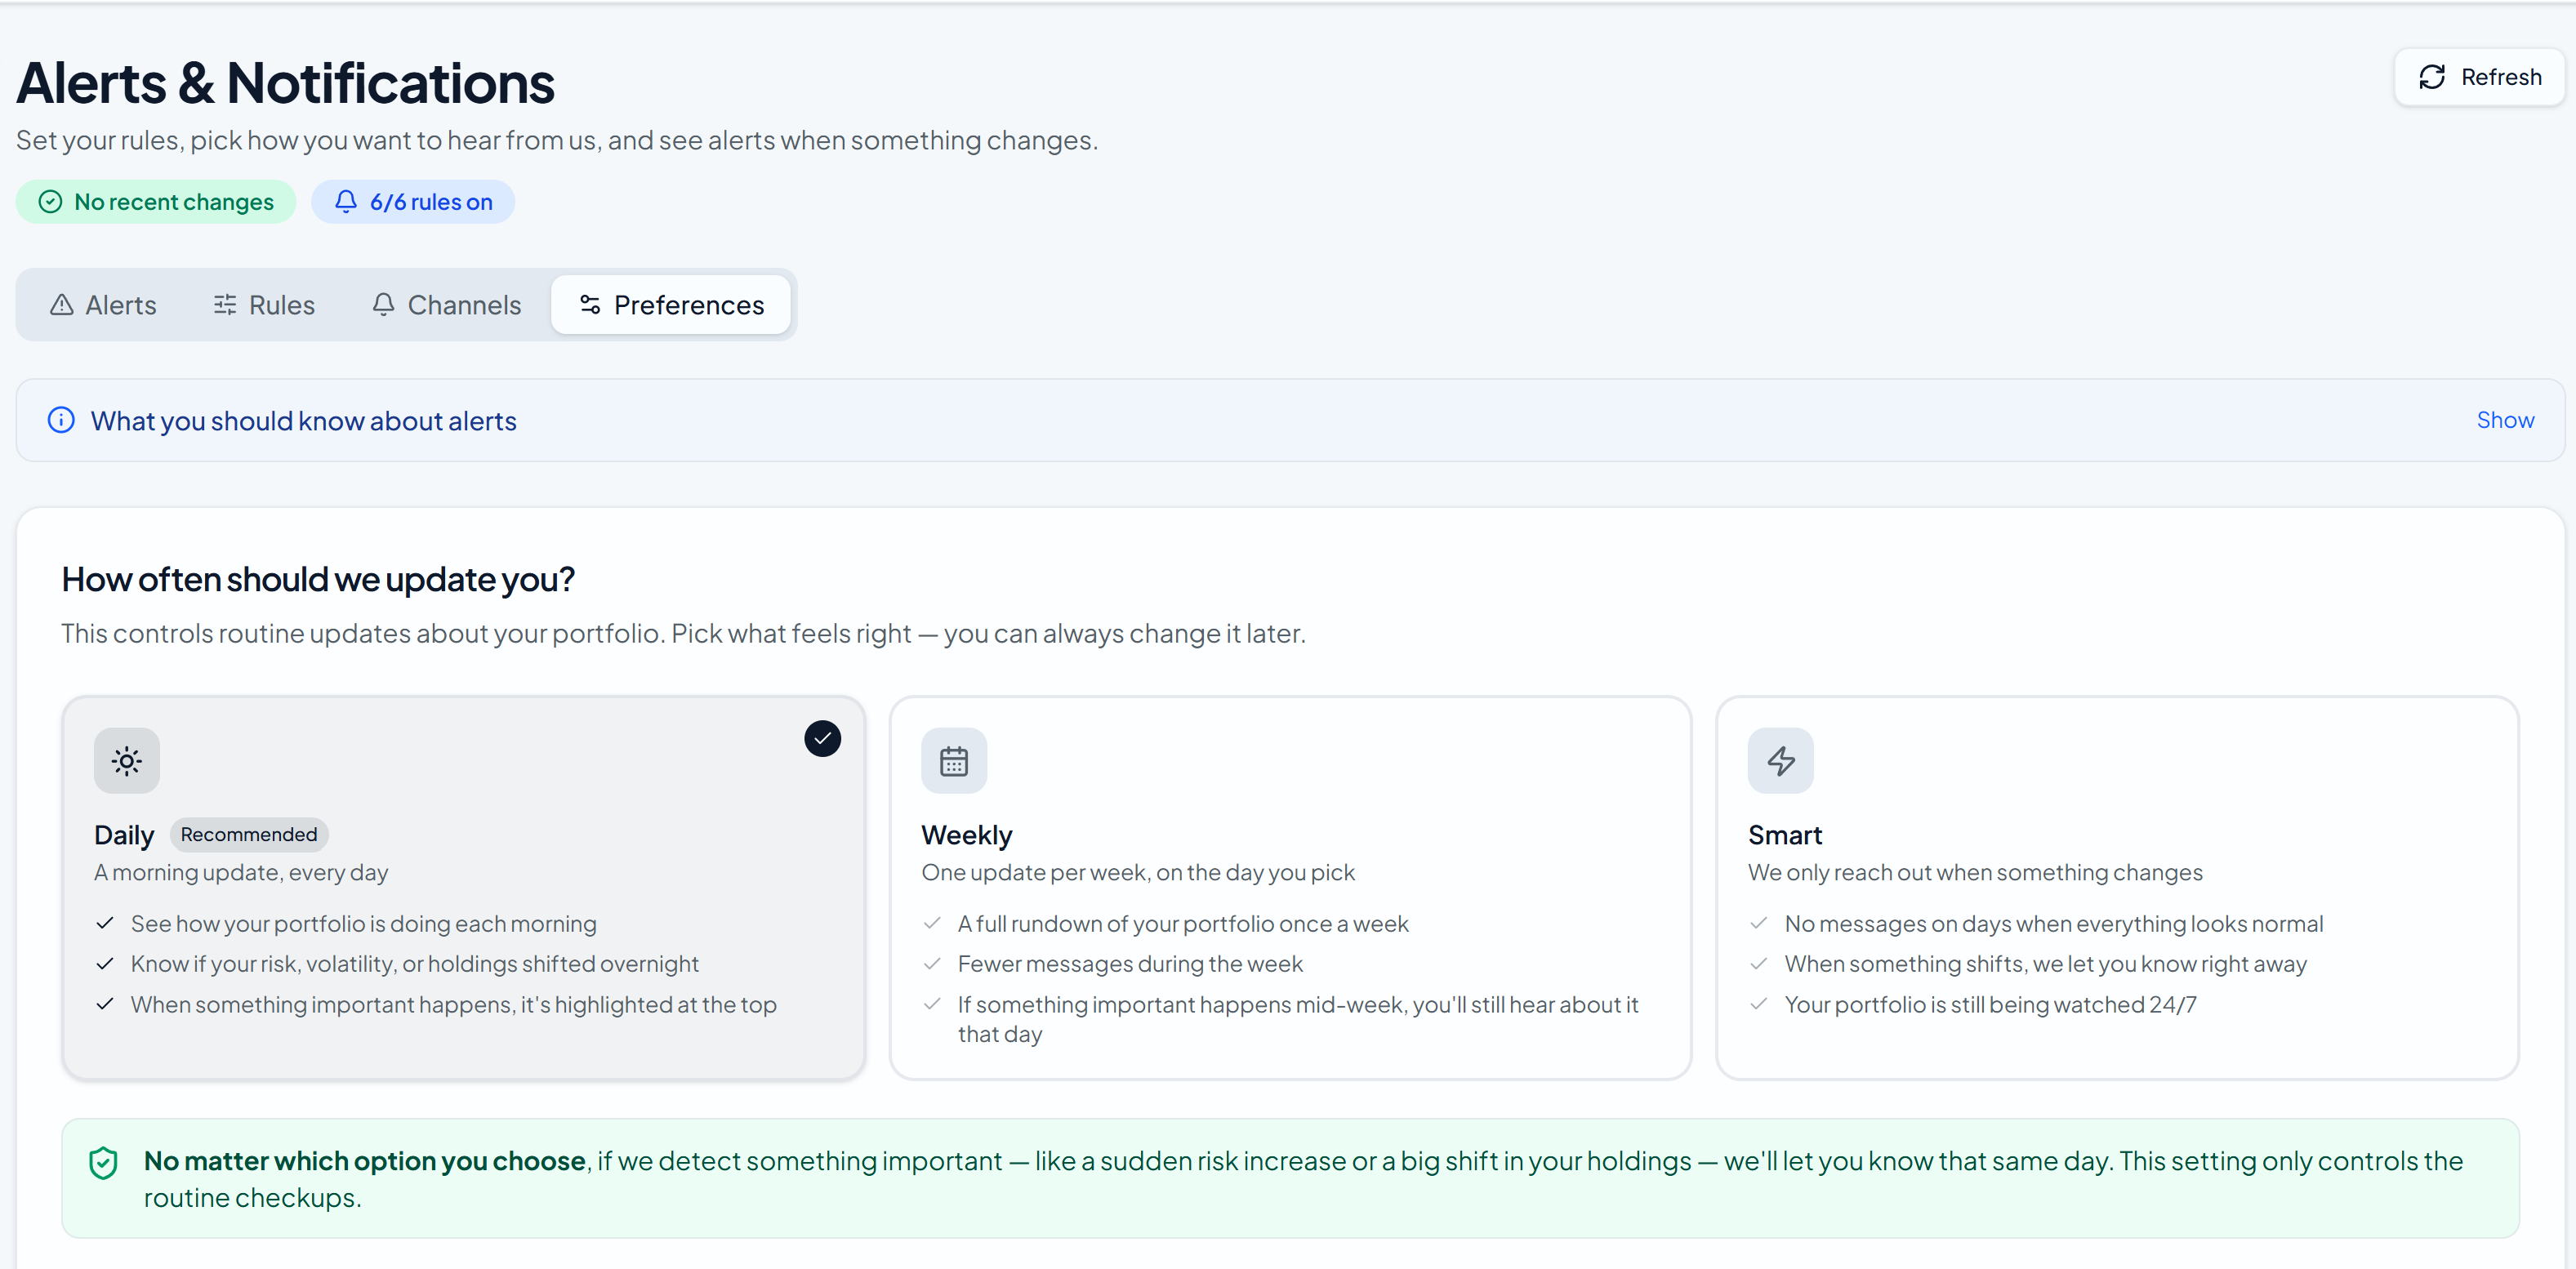
What an alert actually looks like
You set the limits. Guardfolio watches every account and sends one clear alert by email or Telegram the moment a limit is crossed, not on every price move.
Set your limits
For example: no single stock above 10%, no sector above 30%, a drift band of 5% from target.
We analyze each sync
Holdings and prices are checked after portfolio data updates across your connected accounts.
A limit is crossed
A position grows, a sector crowds, or your allocation drifts past your band.
You get one clear alert
Email or Telegram, with what changed and which limit it crossed, so you can decide what to do.
Connect every account for a true risk picture
Risk hides between accounts. A stock you hold directly in one brokerage can also sit inside an ETF in your IRA. Guardfolio rolls every account into one exposure view, so concentration and overlap are measured against your whole portfolio.
Guardfolio connects to 30+ brokers and exchanges through established aggregators (Plaid and SnapTrade), including Schwab, Fidelity, Vanguard, Robinhood, E*TRADE, TD Ameritrade, and Interactive Brokers. Retirement accounts (401(k), IRA, Roth IRA, SEP IRA, and many employer plans) are supported, and you can add any account manually. Guardian Pro currently monitors stocks, ETFs, and mutual funds; cryptocurrency monitoring is available on Guardian Elite. See supported connections →
Read-only by design
Guardfolio is not a broker and not an investment adviser. Connections are read-only.
- No trading access Guardfolio reads holdings to analyze risk. It cannot place trades or move money.
- We never see your password Bank-level encrypted connections run through Plaid and SnapTrade, not Guardfolio.
- You stay in control Disconnect any account at any time. Read our security and data handling.
How the numbers are calculated
Every score and alert is built from your actual holdings and published fund data, with the formulas documented so you can check them.
Swipe the table on mobile to see all columns.
| Risk signal | What it measures | Data source | Freshness |
|---|---|---|---|
| ETF overlap | Shared underlying holdings across your funds | Published fund holdings | As fund holdings are refreshed |
| Concentration | Weight of your largest positions, with look-through into ETFs | Your connected holdings | As holdings and prices change |
| Sector exposure | GICS sector weights across the whole portfolio | Holdings and sector classification | As prices move |
| Allocation drift | Current weights vs. your target bands | Your targets and live holdings | As prices move |
| Volatility and drawdown | Annualized variability and peak-to-trough decline | Price history | Daily |
The exact formulas behind each score are documented in our metrics methodology and alert methodology. Guardfolio provides analysis and monitoring for educational purposes, not personalized investment advice.
CompareRisk monitor vs. portfolio trackers (2026)
Most tools tell you what your portfolio is worth. A risk monitor tells you where you are exposed and alerts you when it changes.
Swipe the table on mobile to compare all columns.
| Capability | Guardfolio | Empower / Personal Capital | Morningstar | Manual (Spreadsheet) |
|---|---|---|---|---|
| Automated monitoring | After each sync | Daily sync | Manual check | When you remember |
| Concentration alerts | Yes, threshold-based | No | No | No |
| Sector drift tracking | Yes, after each sync | Basic allocation view | X-ray (manual) | Manual calculation |
| Correlation matrix | Yes, all holdings | No | No | Requires complex formulas |
| ETF overlap detection | Yes, automatic | No | Via X-Ray (manual) | No |
| Alert channels | Email + Telegram | Email only | None | None |
| Portfolio health score | Yes (0–100) | No | No | No |
| Multi-broker aggregation | Yes, API + manual | Yes, via Plaid | Manual entry | Manual entry |
Portfolio drift in action: How it happens silently
Markets shift your allocation every day. Without monitoring, you won't know until you're dangerously off-target.
📊 Your portfolio (January 2026)
- Target allocation: 60% stocks / 40% bonds
- Fidelity: $300k SPY + $200k AGG
- Vanguard: $250k QQQ + $250k BND
- Actual allocation: 55% stocks / 45% bonds ✓ On target
📉 Six months later (June 2026)
- Tech stocks outperform 15%
- QQQ + SPY grow; AGG + BND flat
- New allocation: 68% stocks / 32% bonds ✗ Off target by 8%
- Without monitoring: You rebalance manually, paying taxes + trading fees
- With Guardfolio: Alert hits week 1, 1-click rebalance suggestion, stay on target
Your monitoring routine in four steps
Effective monitoring connects returns to risk context: benchmark fit, drift, concentration, and overlap in one place. Full checklist →
Aggregate every account
Most investors hold positions across 2–4 accounts. Connect them to a unified tracker so your risk picture reflects total exposure.
Set your risk thresholds
Decide what "out of bounds" means for you. Some investors choose to review when a single position passes 10%, a sector passes 30%, or allocation drifts more than 5% from target. You set the limits.
Turn on automated alerts
Manual monitoring fails because it depends on memory. Guardfolio sends email and Telegram alerts the moment drift, concentration, or volatility changes materially.
Review only when triggered
Good monitoring does not mean checking daily. Trust your system to flag problems and intervene only when a threshold is breached. For most passive investors, that means acting 3–5 times per year.
Related features
Go deeper on the risk signals Guardfolio monitors for you.